
Short ReadsFebruary 15, 2024
Dating Difficulties
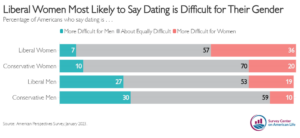
Most singles today do not enjoy dating, and many say dating has gotten worse. But for the most part, Americans believe dating is difficult for men and women alike. Overall, men tend to believe they have it tougher than women, while women say the opposite. Liberal women and conservative men stand out for feeling that
BlogFebruary 9, 2024
Explore Dating Dealbreakers
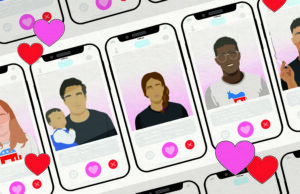
Check out this interactive to explore which characteristics Americans view as the biggest dating dealbreakers and see who cares about which personal qualities.
Short ReadsDecember 8, 2023
Born This Way
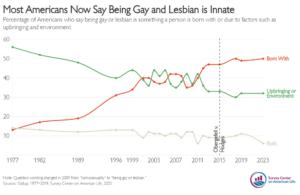
Long before Americans debated the issue of same-sex marriage, Gallup probed public understanding about the nature and origins of homosexuality. In 1977, more than half (56 percent) reported that homosexuality could be attributed to environmental factors or to upbringing; a scant 13 percent viewed being gay or lesbian as something people are born with. Over

BlogJuly 17, 2023
What the Rise in Dog Attacks Signals About the State of America’s Social Capital
In the wake of the pandemic, the increase in both dog attacks and individual antisocial behavior seems to be a consequence of our deteriorating social capital.

BlogApril 26, 2023
Does Politics Make People More Likely to Identify as LGBTQ?
A novel survey experiment tests the relationship between LGBTQ identity and political ideology.
Short ReadsApril 7, 2023
White Evangelical Trump Support Fracturing
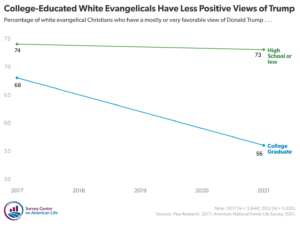
White evangelicals have been Trump’s most consistent and committed supporters throughout his presidency. They overwhelmingly supported Trump in both the 2016 and 2020 presidential elections. More recently, some white evangelicals appear less enthused about Trump. Only 56 percent of white evangelicals with a college degree have a favorable view of Trump, down from 68 percent
Short ReadsApril 4, 2023
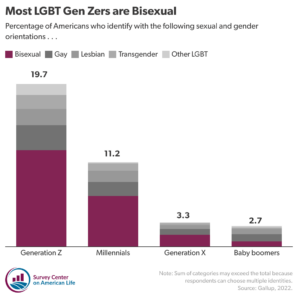
A Generational Jump in Bisexuality
New research finds that one in five adults who belong to Generation Z (age 18 to 25) identify as LGBT. However, most of the increase is due to the jump in bisexual identity—roughly two-thirds of those LGBT Gen Zers are bisexual. Part of this increase in bisexual identity reflects the fluidity with which young people
BlogMarch 15, 2023
Despite Professional Successes Many Women Still Experience Imposter Syndrome
Women in the professional world are thriving and have been pulling ahead of men for years. Confidence in job performance however, remains lower than men of their same age.
Short ReadsFebruary 22, 2023
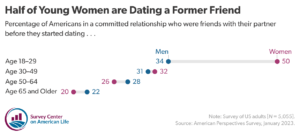
Friend Zone
Dating apps have become an undeniable part of the romantic landscape, but more young people opting for a different strategy of finding a partner: Their friends. A new report, “From Swiping to Sexting: The Enduring Gender Divide in American Dating and Relationships” finds that young adults are much more likely than older Americans to say
Short ReadsDecember 22, 2022
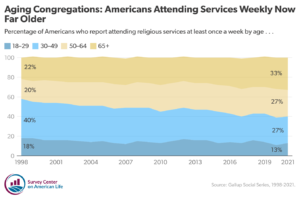
Aging in the Pews
That churches and places of worship have struggled to attract and retain young worshipers is no secret. But new research finds that the most active congregants have gotten far older over the past two decades. In 1998, nearly six in ten (58 percent) Americans who attended religious services at least once week were under the